
Are you struggling to debug your web application hosted in IIS? It can be incredibly frustrating when things go wrong, and you can’t figure out why.
You’re not alone, and you’re in the right place. Debugging is a crucial skill that can save you time, reduce stress, and improve the performance of your web applications. Imagine the satisfaction of identifying the problem swiftly and implementing a solution that works seamlessly.
This guide will walk you through the essential steps to effectively debug your web application in IIS, turning what might seem like a daunting task into a manageable process. Let’s dive in and get your web application running smoothly again.
Setting Up Debugging Environment
First, download the debugging tools from the internet. These tools help find errors in your web application. Choose a tool that is simple to use. Make sure it works with your computer. Install the tool by following the instructions. Always check for updates. This keeps the tool working well.
Open IIS Manager on your computer. Look for the site you want to debug. Click on it to select it. Go to the Properties or Settings menu. Enable debugging options for the application. This helps find and fix problems. Ensure that the permissions are set correctly. This keeps the site safe.
Common Debugging Techniques
Visual Studio is a great tool for debugging web apps. It helps you find errors quickly. You can use breakpoints to pause your code. Check the values of variables easily. This helps you see what goes wrong. The watch window shows variable changes. The immediate window lets you test code quickly. You can fix problems faster this way.
Logs are useful to find errors. They show what happens in your app. Error messages give clues about problems. Check logs for patterns. Look for error codes or warnings. These can help identify issues. Use logs to track user actions. This helps you see what led to errors. Solving problems becomes easier with logs.
Identifying Common Errors
HTTP error codes are like signals. They show problems in web apps. A 404 error means a page is missing. A 500 error shows a server problem. These codes help find where things go wrong. Fixing them can make the app work better. Always check what the error code means. This helps in finding the right solution. Knowing these codes is like having a map.
Application pool failures can stop a web app. It might crash or not start. Reasons include too much memory use. Or bad code. Check the event viewer for error messages. Recycling the application pool can help. It refreshes the app. Keep an eye on these failures. They tell if something needs fixing.
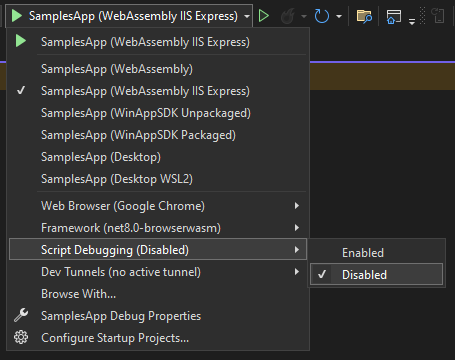
Credit: platform.uno
Debugging Performance Issues
Watch the CPU and memory usage of your web app. Use tools like Task Manager or Performance Monitor. They show how much resources your app uses. If usage is too high, it can slow down the app. Check for any unexpected spikes. These can cause issues. Consistent monitoring helps keep the app fast.
Profiling helps find slow parts in the code. Use tools like Visual Studio Profiler. It shows which parts of the code take the longest time. Focus on improving these parts. Small changes can make the app run faster. This process makes your web app more efficient.
Security And Permissions Troubleshooting
Correct permissions are crucial for smooth operation. Check if your files have read and write access. Sometimes, files might be locked. This can cause errors. Always ensure folders allow access. Permissions should be easy to set. Use the IIS Manager for this. It has a simple interface. Follow the steps given there. This helps solve many issues.
Authentication problems can block access. Make sure the right users can log in. Sometimes, users face login errors. Check username and password settings. Ensure they are correct. Use IIS tools to fix this. Authorization issues stop user actions. Ensure users have needed roles. Set roles in settings. This allows proper access to features. Always verify user roles are updated.

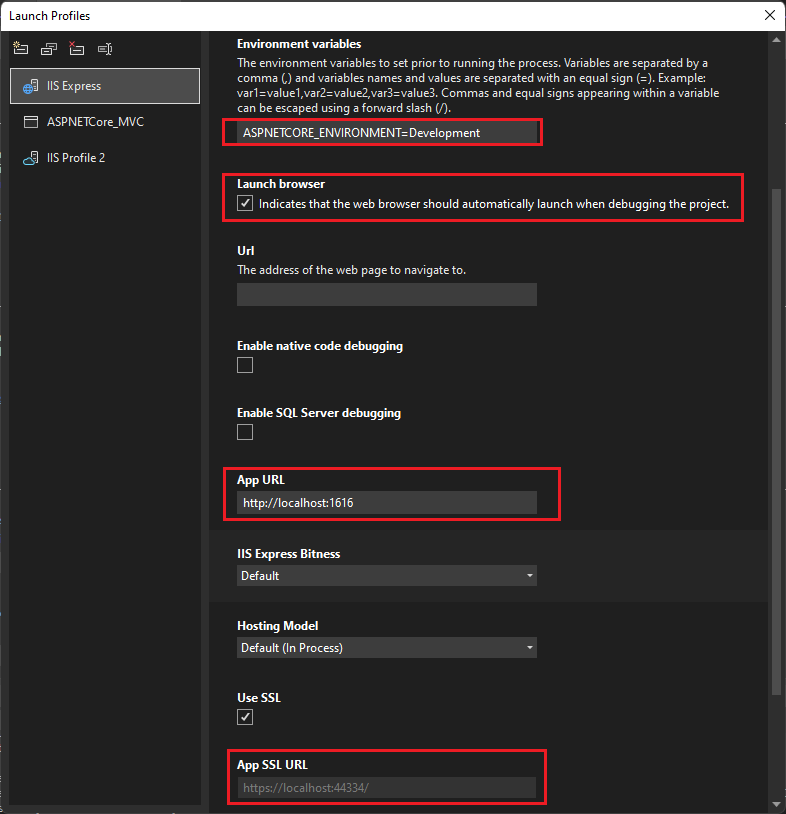
Credit: weblog.west-wind.com
Advanced Debugging Tools
Debugging extensions can help you find errors in your web app. These tools show you where things go wrong. You can use them to see logs and messages. They tell you what is happening inside the app. Extensions like Fiddler and DebugDiag are popular. They make debugging easier and faster. These tools are easy to install and use. Even kids can learn them quickly. Try them to improve your app’s performance.
Remote debugging helps when you can’t access the server directly. This method allows you to fix issues from far away. You need the right tools to do this. Tools like Visual Studio and WinDbg are useful here. They connect to the server over the network. This way, you can debug your app without being there. It saves time and helps you solve problems quickly. Learning remote debugging can be very helpful.
Best Practices For Debugging
Debugging web applications hosted in IIS involves checking error logs, monitoring server processes, and using debugging tools. Isolate issues by recreating errors in a controlled environment and analyze server responses for clues. Regularly update and test application components to prevent common bugs.
Documentation And Record Keeping
Keep a log of all changes made in the code. Include details of errors and fixes. Use simple language for easy understanding. Write clear comments in the code. Comments help others understand the logic. Record the steps taken to fix issues. A detailed record saves time in future debugging. Organize files and folders properly. This makes it easier to find information.
Collaborating With Development Teams
Work together with the team to solve problems. Share information and ideas freely. Communicate clearly about issues and solutions. Use team meetings to discuss errors. Meetings help in understanding different perspectives. Listen to feedback from team members. Feedback improves the debugging process. Encourage the team to ask questions. Questions can lead to better solutions.
Credit: learn.microsoft.com
Frequently Asked Questions
How To Debug An Application Hosted In Iis?
To debug an application in IIS, use Visual Studio’s “Attach to Process” feature. Enable debugging in web. config by setting debug=true. Check IIS logs for errors. Use remote debugging if necessary. Ensure proper permissions and firewall settings for remote access.
How Do I Debug A Web Based Application?
Start by checking browser developer tools for errors. Use console logs to trace code execution. Review network requests and responses. Validate HTML, CSS, and JavaScript for syntax errors. Utilize debugging tools like breakpoints and stack traces for deeper insights.
How To Enable Debugging In Iis?
To enable debugging in IIS, open IIS Manager. Click on the site, then select “Error Pages.” Choose “Edit Feature Settings” and enable “Detailed Errors.” Ensure “Debugging” is enabled in the web.config file by setting . Restart the site to apply changes.
How Do I Add Debugger To Iis .net Core?
Open Visual Studio, select your project, and click Debug > Attach to Process. Choose “w3wp. exe” for IIS. Set breakpoints in your code, then start debugging. Ensure your application is running on IIS and correctly configured for. NET Core.
Conclusion
Debugging a web application in IIS can seem tricky at first. With clear steps, the process becomes simpler. Start by checking error logs for insights. Use debugging tools to trace issues. Test changes in a safe environment. Make sure to monitor performance regularly.
Practice makes it easier over time. Keep learning and adapting to new updates. Successful debugging leads to a more reliable application. This ensures a smoother user experience. Always aim for clarity and efficiency in your debugging process. Your efforts will pay off with a well-functioning web application.


