Are you struggling to pinpoint issues in your Web API hosted in IIS? You’re not alone.
Debugging can feel like a daunting task, especially when you’re dealing with complex systems. But don’t worry, you’re about to discover a straightforward approach to tackle these challenges head-on. In this guide, you’ll learn how to effectively debug your Web API hosted in IIS, ensuring smooth performance and reliability.
Imagine the relief of resolving those pesky errors and enhancing your application’s functionality. Your time is valuable, so let’s dive into practical tips and tricks that will empower you to master the art of debugging. Ready to transform frustration into confidence? Keep reading to unlock the secrets of efficient troubleshooting!
Credit: learn.microsoft.com
Setting Up Your Environment
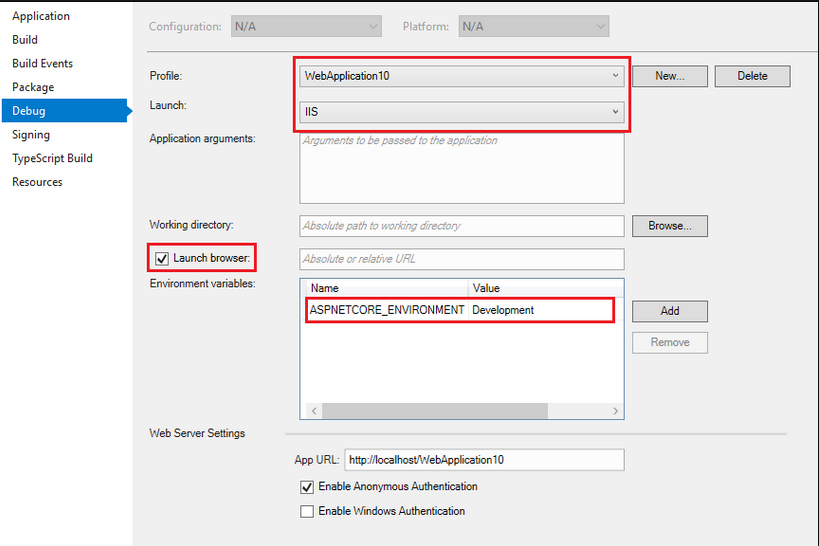
You need Visual Studio for debugging. Download the latest version from its website. Then, install it on your computer. This tool helps you find errors in your code. It’s very important for developers. Also, install the Web API project template. This is necessary to create APIs. Don’t forget to update your system. Make sure it has all the latest updates.
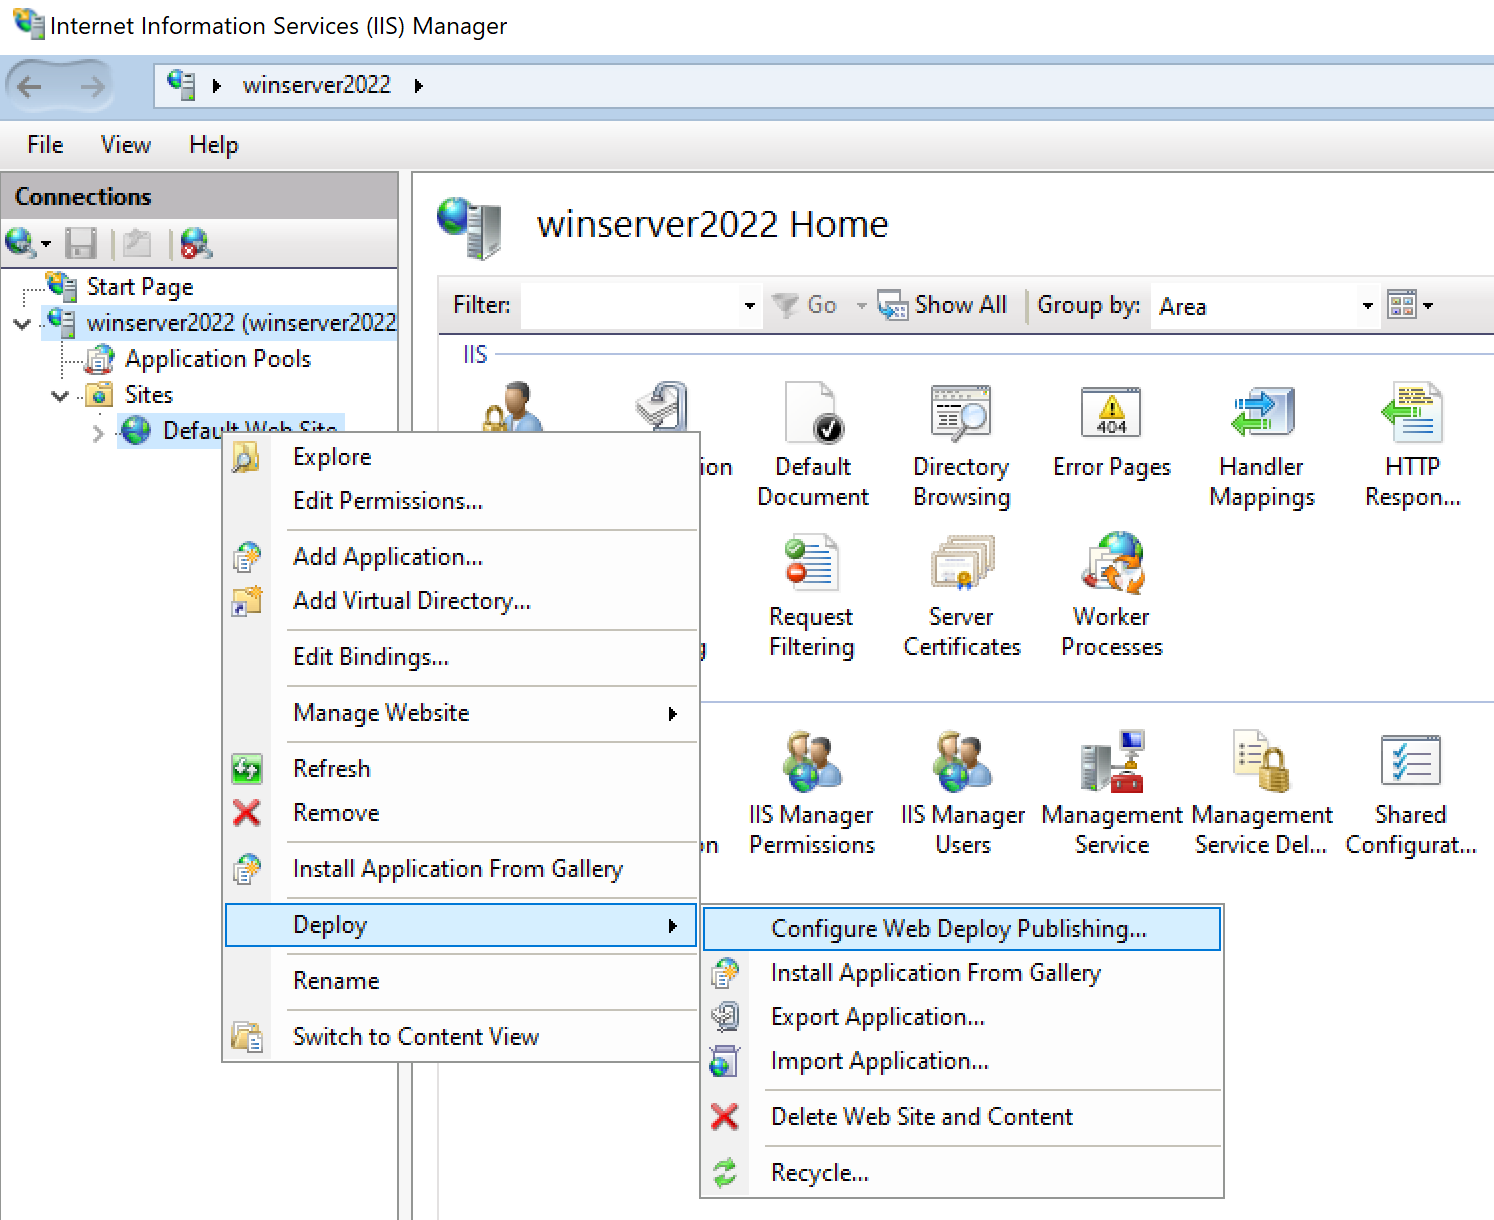
First, open IIS Manager. Find your Web API project. Next, click on the project name. Then, choose the settings option. You need to enable debugging there. This setting helps find issues. Make sure to set the right permissions. These permissions allow access to the API. Finally, save the changes. Check if everything works fine.

Credit: docs.appeon.com
Connecting Visual Studio To Iis
First, open Visual Studio on your computer. Go to the Debug menu at the top. Click on Attach to Process. A new window will open. Look for the w3wp.exe process. This is the IIS process. Select it and click Attach. Now, you can start debugging your Web API.
For remote debugging, you need the Remote Debugging Tools. Install them on the server. Open the tools on the server. Go back to your Visual Studio. Click on Attach to Process. Enter the server name. Choose the correct process. Click Attach. You’re now ready to debug remotely.
Common Debugging Techniques
Breakpoints help you find errors in your code. Place them where you think the bug is. This stops the code at that point. You can then check the values of variables. Make changes and run again. This helps you see if the problem is fixed.
Inspect variables to know what they hold. This helps find issues quickly. Call stacks show the order of function calls. They help you see where the error happens. Use these tools together for better results.
Tracing shows how your code runs. Logging records events in your app. Logs can tell you where things go wrong. Keep logs organized and easy to read. Both tracing and logging are crucial for solving problems.
Handling Common Errors
A 404 error means the server can’t find your page. Check if the URL is correct. Also, make sure the web page exists. Look at your IIS configuration. Make sure your application is in the right directory. Sometimes, missing files cause this error. Check your file paths. Make sure they are correct.
The 500 error means something is wrong on the server. Check your application code for mistakes. Look at the server logs. They can tell you what is wrong. Sometimes, a plugin causes the error. Disable plugins one by one to find the problem. Make sure your server has enough resources. Low memory can cause errors too.
Authentication issues mean you can’t log in. First, check your login details. Are they correct? Look at your IIS authentication settings. Make sure they match your needs. Sometimes, permissions are wrong. Check if your user account has the right permissions. Also, ensure your API keys are up-to-date and valid.
Optimizing Debugging Workflow
Unit tests help find bugs early. They make debugging easier. Create small tests for each function. Use a tool like JUnit or NUnit. These tools check if your code works. Automated tests save time. They run faster than manual tests. Fixing bugs becomes simpler. Keep tests updated with code changes. This ensures your code is always correct.
Debugging extensions make life easier. They help find problems quickly. Browser extensions like Postman test APIs. They show you what works and what doesn’t. Fiddler is another tool. It checks network traffic. This helps spot errors in data flow. Extensions provide extra information. This makes fixing bugs less hard. Use them to improve your debugging skills.
Security Considerations
Secure debugging is very important. Always protect your debugging environment. Use a strong password. Only allow trusted users to access it. Keep your software updated. Updates fix security holes. Never share debug information with strangers. It might contain sensitive details. Use firewalls to block unwanted access. Always log access attempts. Logs help find problems fast.
Sensitive data needs extra care. Always encrypt this data. Encryption makes data safe. Use secure protocols like HTTPS. Do not log sensitive data. Logs can be seen by others. If you must log, mask the data. Masking hides important parts. Regularly check who accesses the data. Limit access to necessary users. Remove unused accounts to keep data safe.
Credit: learn.microsoft.com
Frequently Asked Questions
How Do I Debug A Hosted Web Application In Iis?
To debug a hosted web application in IIS, enable remote debugging. Attach Visual Studio to the IIS process. Check configuration settings, review logs, and use browser developer tools. Ensure symbols are loaded for debugging and verify firewall settings allow communication.
How To Debug The Web Api?
Start by checking API endpoints using tools like Postman. Verify request and response formats. Use logging to track errors. Monitor network activity with browser developer tools. Implement error handling in your code. Test with different data inputs to identify issues.
How To Enable Debugging In Iis?
Open IIS Manager, select your site, and click on “Failed Request Tracing Rules”. Add a new rule, enable it, and configure the tracing settings. Ensure both “Enable” and “Failed Request Tracing” are checked. This enables debugging for IIS.
How To Host .net Core Web Api Application In Iis?
Install. NET Core Hosting Bundle. Publish your Web API. Configure IIS with a new site. Set application pool to ‘No Managed Code’. Point site to published folder. Ensure required ports are open.
Conclusion
Debugging a Web API in IIS requires patience and practice. Start with the basics. Check your configuration settings. Use logging to trace errors. Explore developer tools for insights. Don’t forget to test changes thoroughly. Collaborate with team members for solutions.
Stay updated with new debugging techniques. Remember, every problem has a solution. Keep learning and improving your skills. With persistence, your API will run smoothly. Debugging isn’t just a task. It’s a skill to develop. Apply these tips, and you’ll handle future issues better.
Your API success depends on your commitment to resolve challenges.