Imagine having the power to see exactly how visitors interact with your website, directly from your Windows host. That’s what you can achieve by harnessing the capabilities of Splunk.
As a savvy website owner, you know that understanding web traffic is crucial for boosting engagement and driving success. But where do you start? If you’re determined to decode the secrets of your web traffic, you’re in the right place.
This guide will walk you through the steps to tap into the insights Splunk offers. Get ready to dive deep into your data and uncover the hidden patterns that can transform your online strategy. Are you ready to unlock the potential of your web traffic? Let’s get started!
Credit: www.splunk.com
Setting Up Splunk On Windows
To run Splunk on Windows, check the system requirements. Ensure your computer has enough RAM and storage. A minimum of 4GB RAM is recommended. Your Windows version should be Windows 7 or later. The processor should be at least a dual-core. These are basic needs for smooth performance.
Download the Splunk installer from the official website. Double-click to start the installation. Follow the on-screen instructions carefully. Choose the default settings for a simple setup. Click Next on each screen until you finish. The installation takes a few minutes. After completion, you can open Splunk from the start menu.
Launch Splunk to start the initial setup. Create an admin account with a username and password. This account will manage Splunk settings. Add your data sources to begin tracking web traffic. Splunk will ask for basic network settings. Fill these in carefully. Save changes to finish the configuration. Now, Splunk is ready to use.
Understanding Web Traffic Data
Web traffic comes from different sources. Organic traffic is when people find your site through search engines. Direct traffic happens when someone types your website’s URL directly into their browser. Referral traffic is when users click on links from other websites. Social media traffic is when visitors come from platforms like Facebook or Twitter. Paid traffic is from ads you buy online. Each type helps in understanding how people find your site.
Web traffic data comes from several places. Web servers store logs of visitor activity. Analytics tools like Google Analytics track user behavior on your site. Splunk can gather and analyze this data. Firewalls and security systems also record traffic. Understanding these sources helps you find patterns. These patterns show how users interact with your site. With this knowledge, you can improve your website’s performance.
Configuring Data Inputs
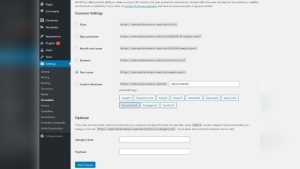
Start by logging into the Splunk interface. Locate the data inputs option. Choose the data source type you want. It could be a file or a directory. Next, click on Add New. Follow the steps to complete the setup. Ensure the data source is active. This will allow Splunk to read it.
Begin by selecting network inputs in Splunk. Choose between TCP or UDP. Both have their uses. Add the network port you want to monitor. Ensure your firewall allows the traffic. This is key for getting data. Verify the settings to ensure accuracy. Now, Splunk will capture network data.
Credit: docs.splunk.com
Creating Splunk Searches
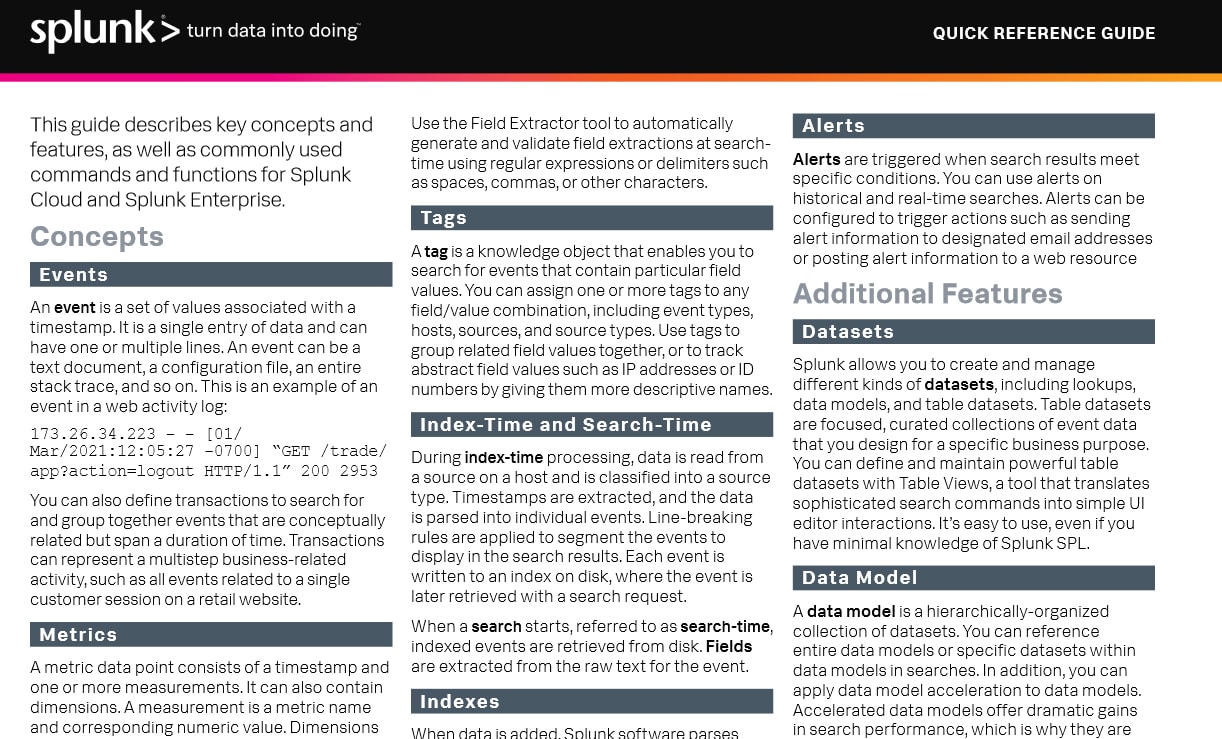
Splunk uses a special language for searches. This is called Search Processing Language (SPL). SPL is simple and easy to learn. You use words like “search” to start a query. Filters help you find the data you need. Use keywords to make your search better. Each search has a command. Commands make searches powerful. You can combine many commands in one search.
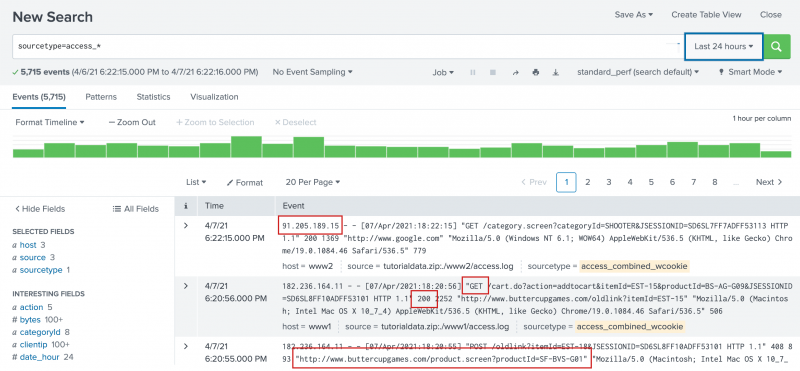
To find web traffic, use Splunk queries. Start with a basic search. Add filters to see web traffic only. Use “source” or “host” to filter results. Look for patterns in data. Check the time range for specific events. Use “stats” to see data summaries. “Count” helps to see how many times something happened. Change your search to get different results.
Visualizing Web Traffic Data
Create a dashboard in Splunk. Use simple steps. First, log into Splunk. Click on the dashboard tab. Choose new dashboard. Name it. Select the format. Save it. You now have a blank dashboard.
Add graphs and charts to the dashboard. Click on the add panel button. Choose the type of graph. Options are pie, bar, or line chart. Connect it to your data. Customize the colors. Make it easy to read. Graphs show web traffic trends. Charts help compare data. You can see traffic peaks. Understand your web traffic better.
Analyzing Traffic Patterns
Identifying trends is important in understanding web traffic. By using Splunk on a Windows host, you can see patterns. Patterns show how traffic changes over time. It helps to know when most people visit. This can help plan better. Understanding these trends can make websites better.
Recognizing anomalies means spotting unusual traffic. Sometimes traffic can spike or drop suddenly. Splunk helps find these changes. Anomalies can mean problems or special events. Finding these quickly is important. It helps to fix issues before they become big. Spotting anomalies keeps websites running smoothly.
Troubleshooting Common Issues
Discover how Splunk can help identify web traffic on a Windows host. Simplify troubleshooting with step-by-step insights. Enhance your understanding of data flow with this powerful tool.
Network Data Errors
Network data errors can disrupt your web traffic analysis. First, check your network settings. Incorrect settings can block data flow. Ensure firewall rules allow Splunk traffic. Next, verify your data source. Broken sources lead to inaccurate results. Always validate network connections. Use ping tests for basic checks. These tests help find connection issues quickly. Also, inspect your logs. Logs reveal hidden problems. Look for unusual error messages. They often pinpoint specific issues. Regular checks can prevent future errors. Monitoring is key to smooth operation.
Search Query Problems
Search query problems can hinder data retrieval. First, review your search syntax. Incorrect syntax leads to failed searches. Ensure your queries follow proper format. Check for typos or misplaced symbols. Small errors can cause big problems. Next, test your queries regularly. Testing ensures they work as expected. Adjust queries based on results. Sometimes, simple changes improve performance. Use search logs to find issues. Logs show query execution details. They highlight errors and inefficiencies. Regular analysis helps optimize queries.
Credit: lantern.splunk.com
Best Practices For Monitoring
Data updates keep your information fresh. Set regular times for updates. This way, your system stays accurate. Missing updates can cause problems. Your traffic data might not be right. It’s important to follow a schedule. Check your settings often. Make sure data feeds work well. This helps in finding issues early. Use logs to track changes. Keep records for future checks. This way, you stay informed.
Security is very important. Protect your data from threats. Use strong passwords. Change them often. Keep your software updated. This stops hackers. Check for unusual activities. Use alerts to warn you. Secure your network. Only allow trusted devices. Use firewalls for added safety. Backup your data regularly. This saves you if something goes wrong. Teach your team about security. Everyone should know the rules.
Frequently Asked Questions
How Do I Know If Splunk Is Running On Windows Server?
Check Splunk status by opening Task Manager on Windows Server. Look for “splunkd. exe” under processes running.
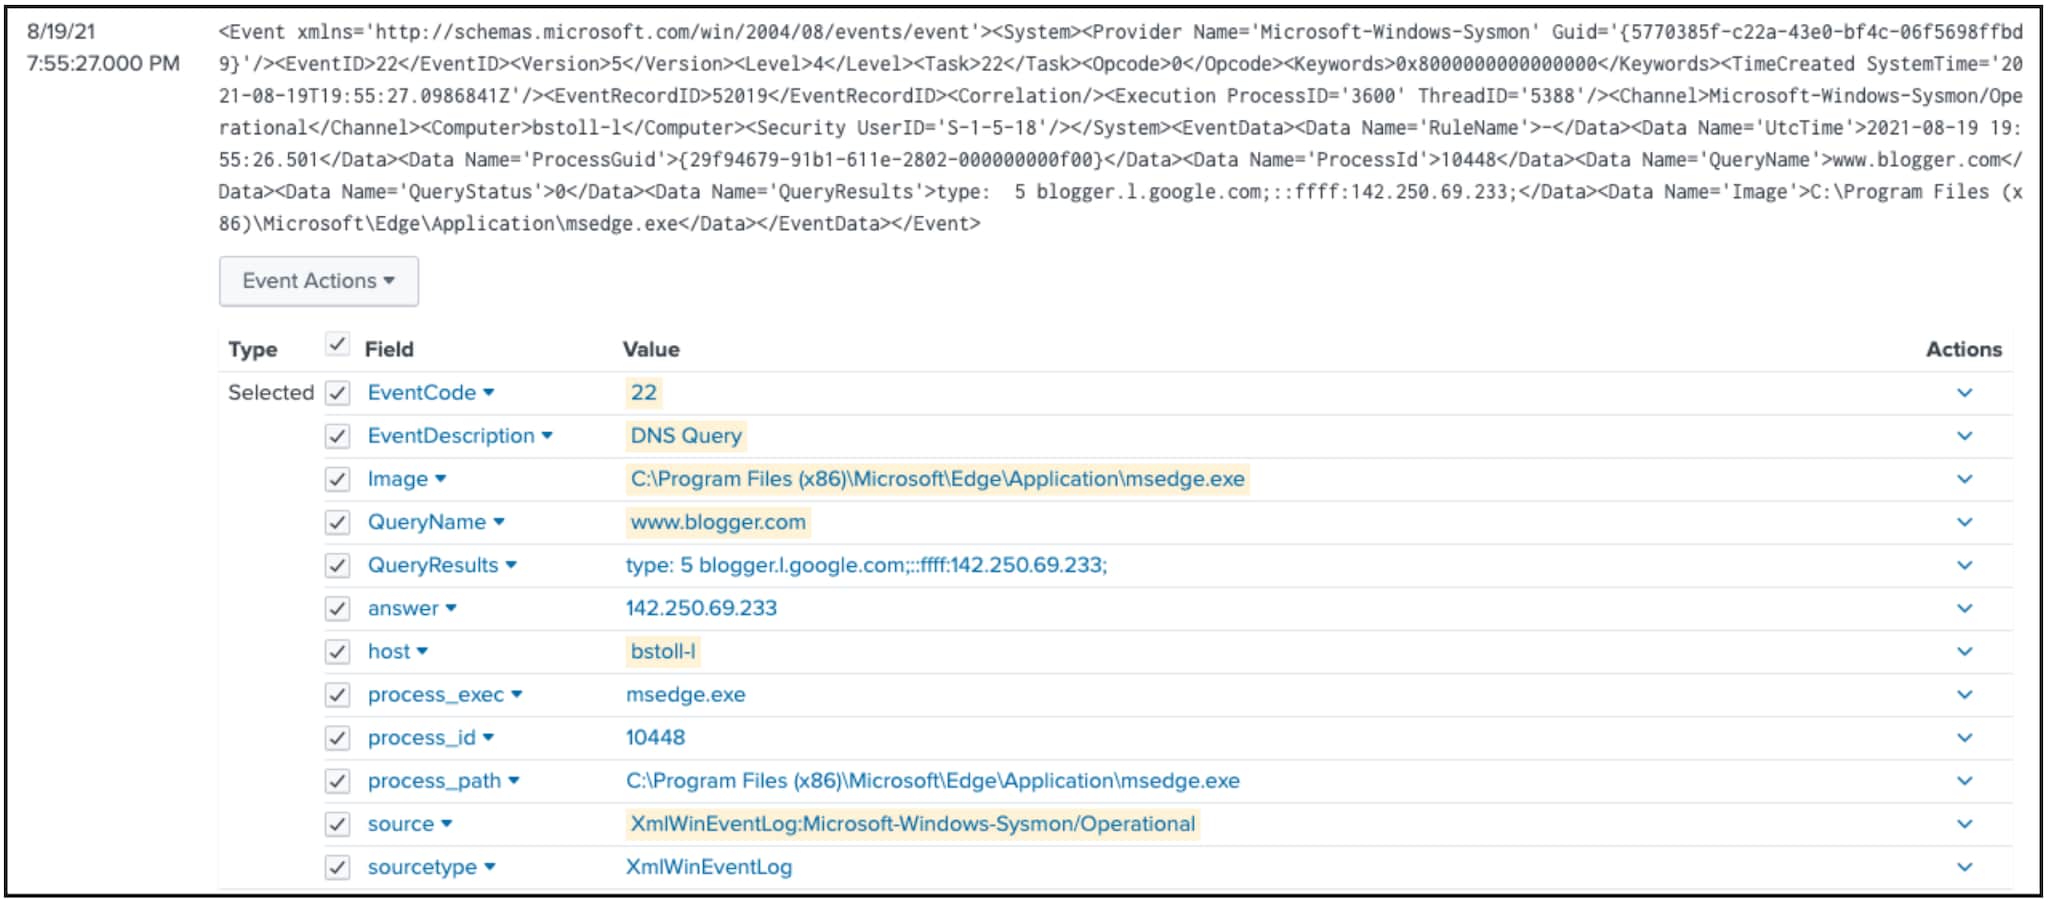
How Do I Check Splunk Logs In Windows?
Open Splunk, navigate to the Search & Reporting app, and enter your search query to view logs. Use filters to refine results and monitor Windows logs efficiently.
How To Access Splunk Web Interface?
Access Splunk Web by entering “http://:8000” in your browser. Replace with your server’s name or IP. Ensure Splunk is running. Log in using your credentials.
How Do I Open Splunk On Windows?
Open Splunk on Windows by clicking the Start menu. Type “Splunk” in the search bar. Select “Splunk Enterprise” from the results. Alternatively, use the Splunk shortcut on your desktop if available. Ensure Splunk services are running for successful access.
Conclusion
Finding web traffic with Splunk on Windows is straightforward. Splunk simplifies data analysis. Its user-friendly interface helps track web traffic easily. With Splunk, you gain valuable insights. You can monitor patterns and trends effectively. This tool offers real-time data access.
It enhances decision-making. Splunk’s features make it a great choice for users. You can customize dashboards to suit needs. Regular monitoring improves system performance. Using Splunk, you can optimize traffic analysis. It supports better security measures. Explore Splunk features today.
Boost your web traffic understanding with ease. Keep learning and stay informed.